 Field notes ·
 MPPscan's all-time volume fell 97% in six days. Cumulative counters can't do that.
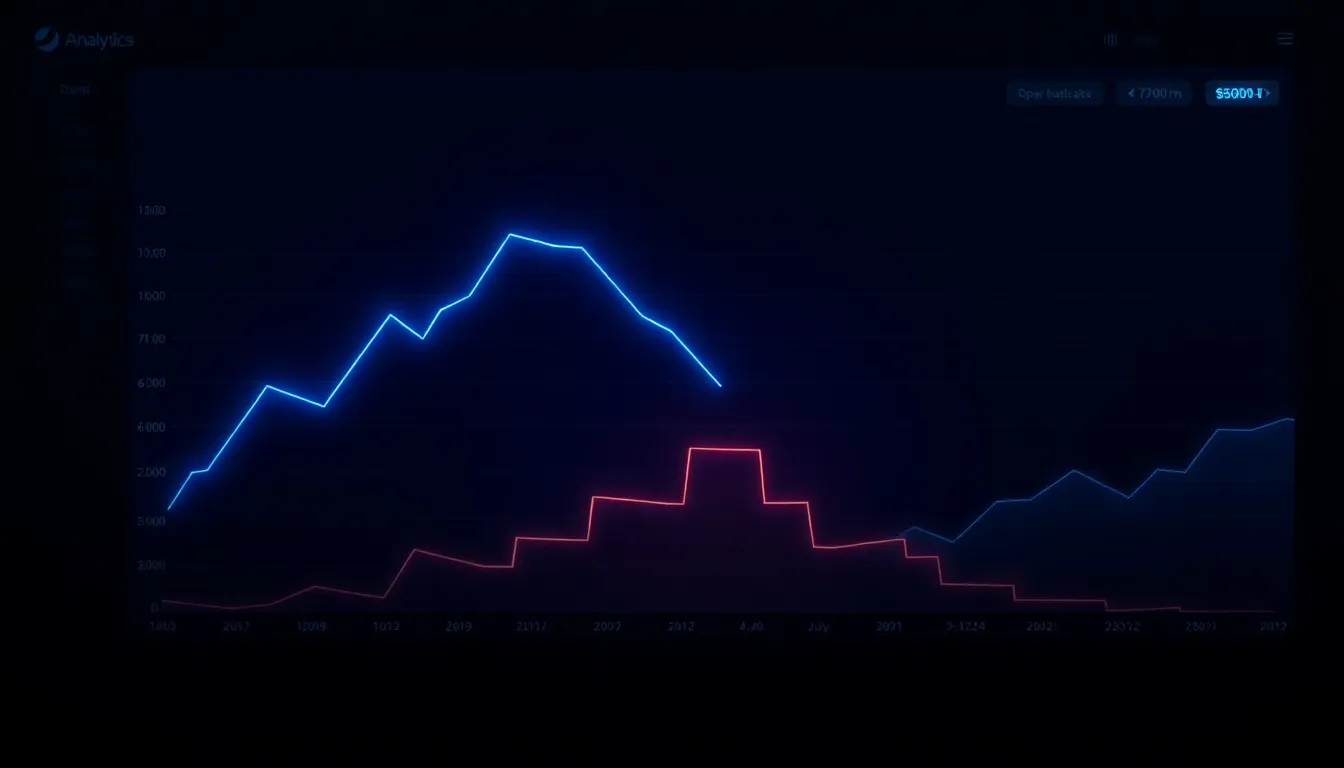
Tonight MPPscan's headline "total volume" reads about $2,370. On August 19 the same counter read $94,874. We know because we log it every day at 12:45 UTC for the rail pulse on our homepage — and for six straight days the all-time total has gone down. That is not a market move. Cumulative totals only ever grow. When one shrinks 97.5% in a week, the story isn't the volume — it's the counter.
What our logs show
We snapshot MPPscan's server-rendered stats daily (the same numbers anyone sees on the site) and alert on ±5% moves between polls. The sequence: $94,874 on Aug 19 → $40,149 on Aug 23 → $22,466 on Aug 24 → $8,039 at Aug 25 midday — and then another −48.6% between two polls a few hours apart on Aug 25 evening, landing near $2,345. Transactions followed the same slope: 259,167 down to roughly 131,000. Both counters have since resumed ticking upward from their new, much lower floors.
"All-time" MPP volume, Aug 19 → Aug 25 ($94,874 → ~$2,345), as logged daily by our rail pulse.
The all-time transaction counter over the same six days — also a number that should only rise.
Change in live x402 catalog listings (15,145) over the same period, per our own crawler. The ecosystem itself barely moved.
What it isn't: a collapse in real activity
Our own vantage point on the agent economy stayed flat through the whole window. The x402 catalog our crawler indexes three times a day held near 15,100 live listings (−0.8% day-over-day). Settlement cadence across our own fleet wallets didn't change. Nothing we operate or index looks like a market that just lost half its history.
Two explanations fit the shape
If the counter is actually "trailing N days," a burst of activity in late July would age out of the window day by day — producing exactly this staircase decay while the counter keeps ticking up from each new floor. The daily-step pattern in our logs fits this best.
Explorers restate history when they find double-counted transfers or drop a data source. That usually lands as one big correction, not six consecutive daily cuts — but a rolling backfill could look like this too.
We genuinely don't know which it is — MPPscan doesn't publish a methodology page, and we'd welcome a clarification from the team. Either way, the practical consequence is the same: anyone who quoted "MPP volume" off that headline number this week was off by up to 40× depending on which day they looked.
The takeaway for agent-economy numbers
The agent-payment ecosystem is young enough that most of its "market data" comes from a handful of small dashboards, each self-reporting with unstated methodology. That's not a criticism — we run dashboards too — it's a reason to treat every headline stat as a claim, not a fact. Our rules after this week: log the source daily so restatements are visible; label every third-party number as self-reported (our rail pulse already does); and never cite a cumulative figure without knowing whether it can shrink. If a number that can only go up goes down, that's not noise. That's the story.
Verify, then trust
We watch the agent-payment rails so you don't have to — catalog counts, settlement activity, and the dashboards reporting on both. Run the free readiness scan or get the kit that ships a monitored, payable server in an afternoon.
Related reading: Solana just flipped Base on daily x402 transactions — our catalog data says it's not a builder exodus.
- mpp
- data-hygiene
- agent-payments
- field report
 546 Bots Visited Our Fleet This Week. Eight of Them Paid.
 The Machine-Native Economy Starts Before an Agent Pays
 Build an AI Shopping Agent That Knows What a Deal Costs
 AI Shopping Assistants: A Better Way to Find Gifts
 Kronos Futures: Three Paid Calls That Turn a Price Range Into a Sized Perp Decision, a Funding Read, and a Survival Check
 The Banks Are in One Room in Miami Practicing a Rail With No Public Chain in the Middle. Here Is the Whole Week, Dated.